
How Do You Want Your Money To Act?
Years ago, when you made your first investment, you were told “not to watch your money,” …“it will go up and down but don’t worry,” …“you will need to ride out losses,” …“over the long-run you should be OK and make good money,” and …“you must take risk to get high returns to succeed.”
From the beginning, you have been told, “You cannot control your money.” What if all these things you have been told are incorrect, and not in your best interest? What if you could control your money, actually make your money act any way you want it to? Don’t let your broker or advisor control your money; it’s not their money, it’s yours. You must learn how to control your money the way you want it to act. If you are like most people, you have probably been given two (2) main “pillars of knowledge” that have guided your investment decisions:
- It’s best to “hang in there” and “ride it out” when there are big stock market losses.
- If you “hang in there” and “ride out” stock market volatility and losses, you should get an annual rate of return of 10% or more.
You have invested based on these two (2) premises, both old-school and outdated, and the problem is that neither are in your best interests, and they simply aren’t true. They are myths, and they are myths that, if believed, can ruin your retirement. We call these: The myth of “riding out the market” and the myth of “getting a 10%+ annual return.”
Here’s the truth that no one has ever told you. The S&P 500 Index was at 1,469 in January 2000 and ended at 2,506 in 2018. This looks like a huge gain. However, to receive this growth, you had to “ride out the market.” In fact, you had to ride out two (2) large approximately -50% stock market losses, the first during the Technology Bubble from 2000-2002 and the second during the 2008 Financial Crisis from 2007-2009. But if you were a “good investor” and “hung in there,” you “stayed in the market” and you “rode it out,” you were rewarded with this seemingly large gain from 2000 through 2018 with the S&P 500 Index growing from 1,469 to 2,506. The problem is, no one has told you the truth, because the average annual compounded increase to the S&P 500 Index from 2000 through 2018 was only 2.85%. And this is before fees. Many retirees pay 3% or more in total fees without even knowing it, so the potential growth net of fees could be non-existent.
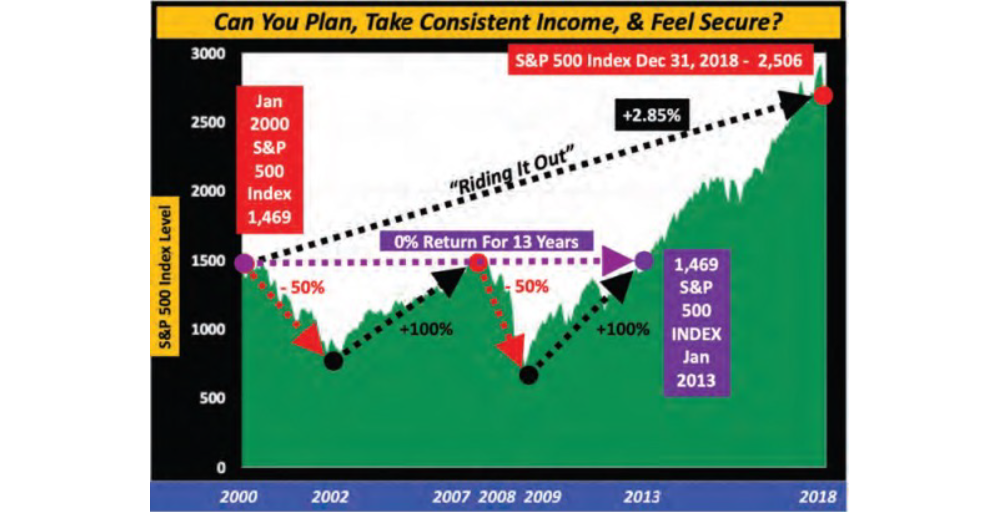
The 2.85% average annual increase to the S&P 500 Index between 2000 through 2018 is an accurate number because you “rode out” an approximate -50% stock market collapse during the Technology Bubble between 2000-2002, recovered by 2007, and then “rode out” another stock market collapse of approximately -50% during the 2008 Financial Crisis between 2007-2009. After the -50% loss from 2000-2002, you had to make +100% just to recover by 2007. Then after the second loss of -50% from 2007-2009, you had to make +100% again just to recover by 2013. Two (2) -50% losses required two (2) +100% recovery gains just to break even, not to make any gains, just to recover.
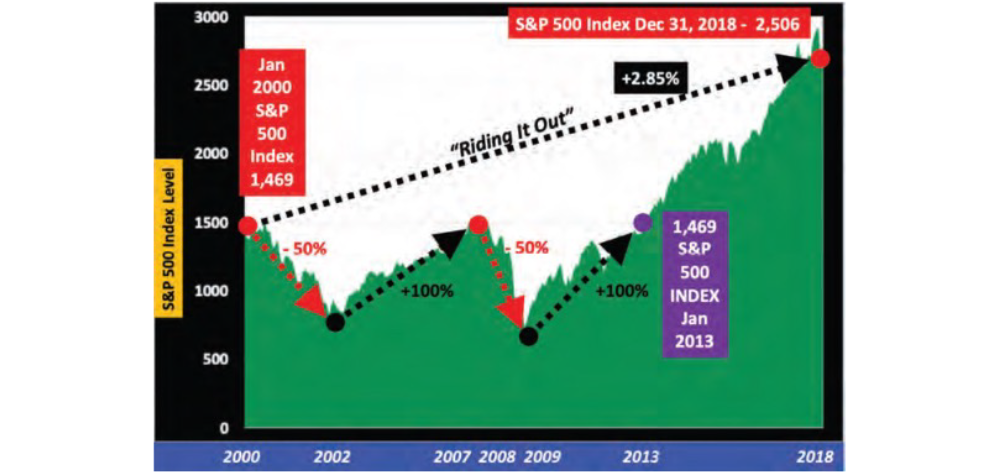
The S&P 500 Index was at 1,469 in January 2013, the exact same level as January 2000. These two (2) separate sets of approximately -50% stock market losses caused a 0% increase to the S&P 500 Index from 2000-2013, a period of 13 years, before fees.
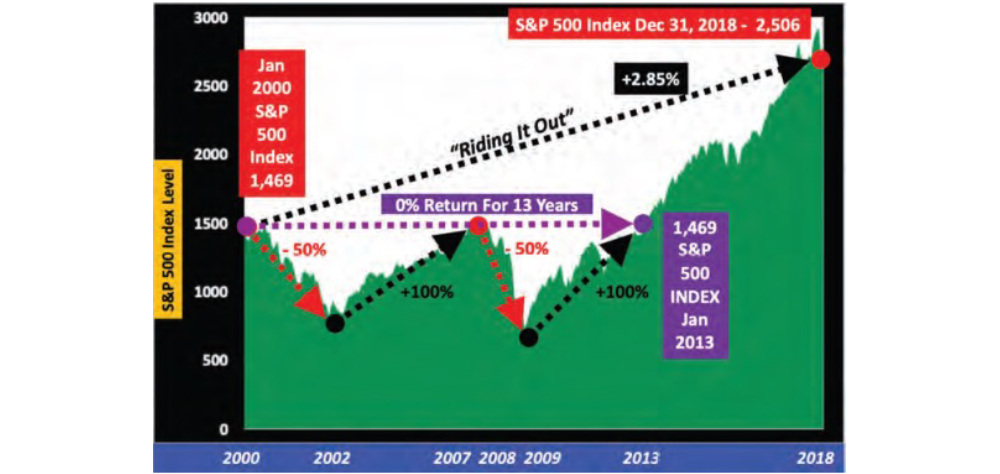
Think about what the previous chart is really showing. Between 2000 and 2013 the stock market, represented by the S&P 500 Index, had two (2) -50% losses and two (2) +100% gains. The two (2) -50% losses total -100% in losses and the two (2) +100% gains total +200% in gains. And yet, contradicting all the math you have ever been taught, -100% in losses plus +200% in gains equal a zero percent (0%) gain over 13 years. Maybe this is what the kids call “New Math?” The stock market lost -50% between 2000 through 2002 and then fully recovered by 2007. And then the stock market lost -50% from October 2007 through March 2009, and then fully recovered by January 2013. However, for 13 years, between 2000 through 2013, the stock market was completely flat, increasing 0% per year.
By “hanging in there” and “riding it out,” the stock market recovered all of its’ losses over 13 years. But here is the key, while you were saving money, did you base your plans for retirement, how much income you could take out of your assets, and how long your money would last on earning 0% for 13 years? Additionally, you must reduce the 0% annual increase for 13 years by any fees you paid. If you were taking income out during this time period it was even worse because if you study the previous graph closely, the market was under the 0% return line for almost the entire 13-year time period. This means you were almost always taking income distributions out while your account was in a loss position, simply meaning everything was worse, and you could run out of money faster.
After looking at the last chart on the preceding page, many retirees and pre-retirees have told us the graph and numbers simply can’t be true because their accounts grew by more than 2.85% during the time period between 2000 through 2018 while they were working. We then tell them their account value could have increased by more than we are saying, probably not from stock market growth, but because they continued to add large deposits into their 401(k) and other plans. Most of their growth actually came from their own additional contributions.
During the Technology Bubble stock market collapse from 2000 through 2002, you were told to ride out the market volatility and losses because you are in it for the long-term and you would be rewarded with a big rate of return because the stock market always averages a 10%+ rate of return. So in 2000, after the market dropped -10%, you were told “don’t worry about it,” …“it’s just a short-term loss,” …“you will recover quickly,” …“it won’t go down that much,” …“don’t watch it all the time,” and …“the return you get will be worth all the risk you are taking.” You probably heard some of these same instructions from your advisor recently because of how volatile the stock market has been.
And then the market went down a second -10%, bringing your total losses to -20%, and you were told the same things. Then the market went down a third -10%, bringing your total losses to -30%, and you were fed the same information. Then the market went down a fourth -10%, bringing your total losses to -40%, and guess what, the same things were said. Then the stock market went down a fifth -10%, bringing your total losses to -50%, and they told you the same things: “don’t worry about it,” …“it’s just a short-term loss,” …“you will recover quickly,” …“it won’t go down that much,” …“don’t watch it all the time,” and …“the return you get will be worth all the risk you are taking.”
But guess what? None of them were true. It didn’t work out that way at all. During the 19-year time period from 2000 through 2018, if you “rode out” the market you:
- Suffered two (2) different approximate -50% losses.
- Needed two (2) different +100% returns just to recover, not to make any money, just to recover.
- Were rewarded with a whopping +2.85% annual compounded increase from the S&P 500 Index. The 2.85% annual compounded increase was before fees.
You could have gotten a higher rate of return from CD’s in the bank. If you had bought a 5-year CD in 2000, renewed it at a lower rate in 2005, renewed it at an even lower rate in 2010, and renewed it at an even lower miniscule rate in 2015, you would have beat the stock market returns. Based on data provided by www.gobankingates.com and www.jumbocdinvestments.com, the average annual compounded return from 5-year CD’s from 2000 through 2018 would have been 4.15%. We aren’t saying to put all your money into CD’s as current rates are very low. We are just emphasizing the fact that the stock market did not provide you anywhere close to the rate of return you were told you’d earn and you should have received based on how much risk you were taking.
We believe you should never “ride out big losses in the market.” We will never tell you to ride out big losses in the stock market. Every plan we create is to avoid big losses in the stock market because as a retiree, you can’t afford to take a big loss at this time in your life. Here’s the big question: can you plan, take a high level of consistent income, and feel secure if your assets are behaving like this? The answer is you can’t. It’s basically mathematically impossible, for you to plan, take a high level of consistent income, and feel financially secure you will never run out of money for as long as you live, especially net of fees, if your assets are subject to high volatility.
We have heard many advisors and retirees say we will never have another stock market decline like the Technology Bubble between 2000 through 2002 or the Financial Crisis from October 2007 through March 2009. When we hear these comments, we are dumbfounded, shocked, and concerned, because we believe you will most assuredly go through not just one more big stock market crash and loss in your life, but actually many of them between now and the time you pass away. Not a real warm and fuzzy thought, we know. Large stock market losses are just part of the normal cycle the stock market will always go through. It goes up, it goes down, it goes back up, it goes back down, and so on.
So here is the key: Stock market losses aren’t bad, they are normal, and they are supposed to happen. What’s bad is if you are a retiree and you don’t protect your assets against the large stock market losses that will inevitably happen.
Do you think you will need to navigate any more -40% stock market losses in your lifetime? The truth is you probably will. Depending on how old you are, you may have to navigate many more -40% stock market losses. Isn’t that a scary thought? What if you are using your assets for income and you lose 40% of your portfolio? We will show you in later chapters how many more -40% stock market losses you should be prepared to go through.
By Dan Ahmad & Jim Files