
Why Should Retirees Avoid Volatility?
We think 15-years is a long time. If you’re 70, then 15-years could represent your life expectancy.
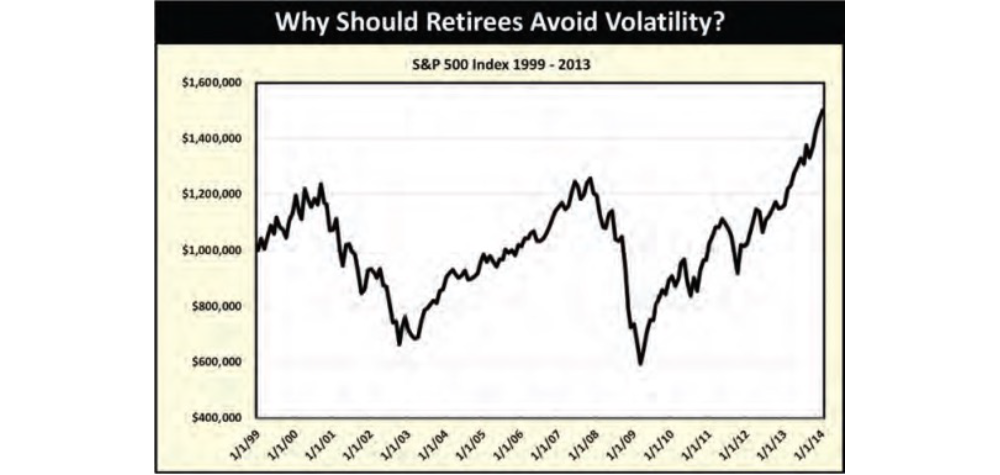
Let’s look at a 15-year graph of the S&P 500 Index starting in 1999 and ending in 2013, that’s when we finished writing the text of one of our books titled Don’t Bet the Farm. We did a significant amount of research on the S&P 500 Index to complete that book. Because we only work with retirees, we wanted to review what happened over the previous 15 years in the stock market to prepare for what types of pitfalls may lie ahead in the next 15 years based on normal average life expectancies. There was volatility, and there was growth. But what we ultimately found out was nothing short of astonishing.
When you first started saving, you were told to “invest money,” “don’t watch it,” “don’t worry about it,” “always leave it in” and “ride it out.” And if you did all of these things, you were told the stock market would always go up and you’d earn a really good rate of return. If you don’t
believe the stock market will always go up over time, you’d better not have any money invested in the stock market! We believe the stock market will always go up over time. But that’s not the complete answer, as we must look at three (3) variables to explain our complete opinion:
- The first variable is to determine how much volatility you have to go through during the time period your money’s invested in the stock market? If you look at the graph above showing the stock market between 1999 through 2013, you can easily see there was a tremendous amount of
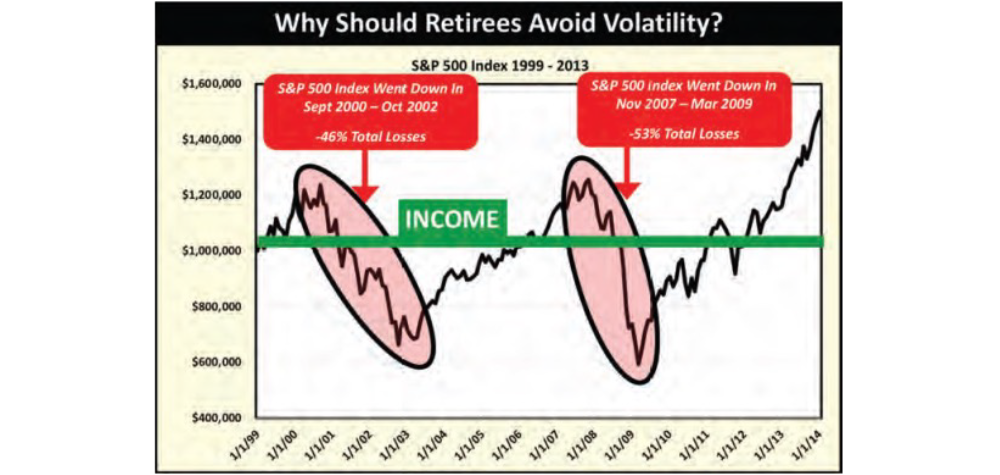
volatility. The Tech Bubble between 2000 through 2002 caused a huge loss, and the Financial Crisis in 2008 did the same. But if you stayed in the stock market, “rode it out” and you “never got out,” starting in 1999 you made money, you lost money in 2000 through 2002, you made back losses in 2003 through 2007, you lost money again in 2008, and then you potentially made your losses back from 2009 through 2013. - The second variable is the time period money was invested to achieve the ultimate rate of return. In this case, the time period is 15 years, a very reasonable time period to use for analytical purposes for a retiree.
- The third variable is to then calculate out the actual rate of return achieved by “riding it out” over the specified time period. Your broker or advisor probably stated you made a great rate of return by “riding it out” because the S&P 500 Index started at around 1,200 in 1999 and ended
at close to 1,800 in 2013. In this chapter, we will show you the annual average compounded increase to the S&P 500 Index during the 15-year time period from 1999 through 2013.
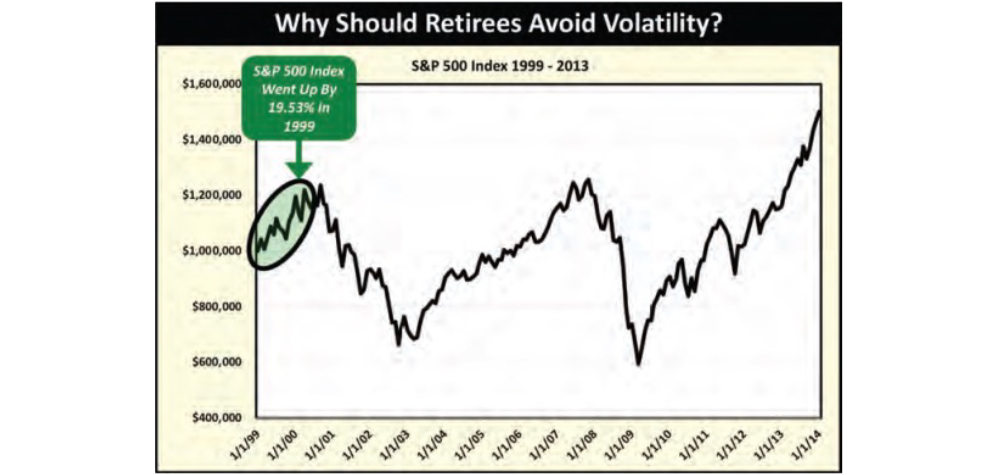
From 1999 to 2000, the stock market, measured by the S&P 500 Index, went up by 19.53%, so people made a lot of money. They were happy. You probably thought the stock market wasn’t going to go down for a long time.
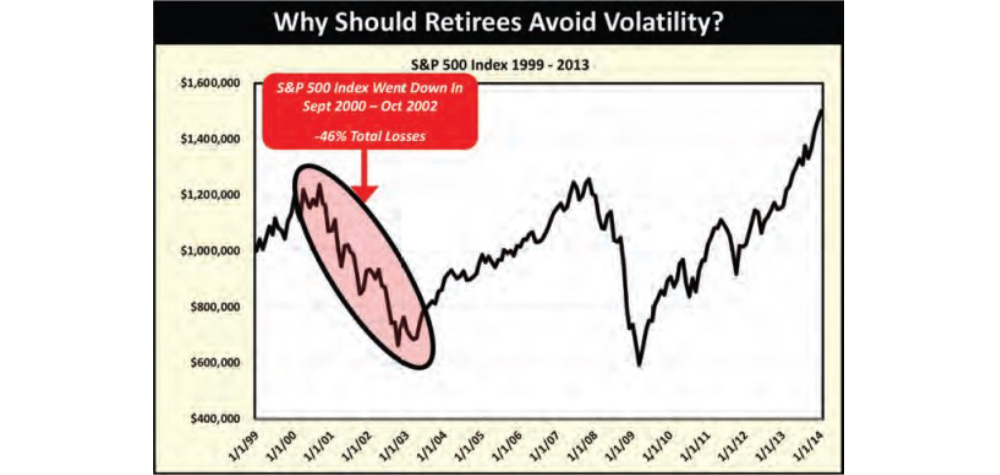
Then came the Tech Bubble when the S&P 500 Index lost -46% between 2000 and 2002. You were probably told to “ride it out,” and by doing so you lost a lot of money. You may have been fed the famous line of malarkey saying, “your loss is only on paper.”
Here’s a secret: If it’s on paper, it means you lost money. It took until 2007 just to recover, and you hadn’t made any money. Fees you paid and income you withdrew would elongate the recovery process.
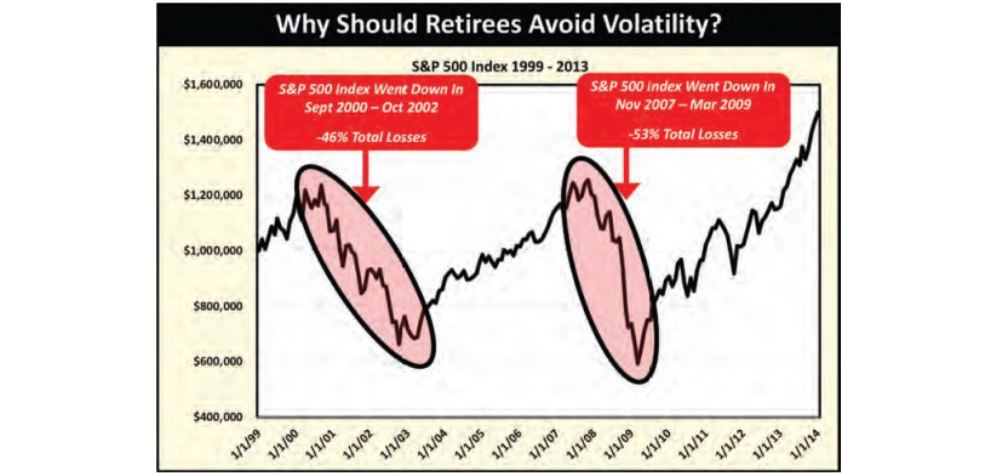
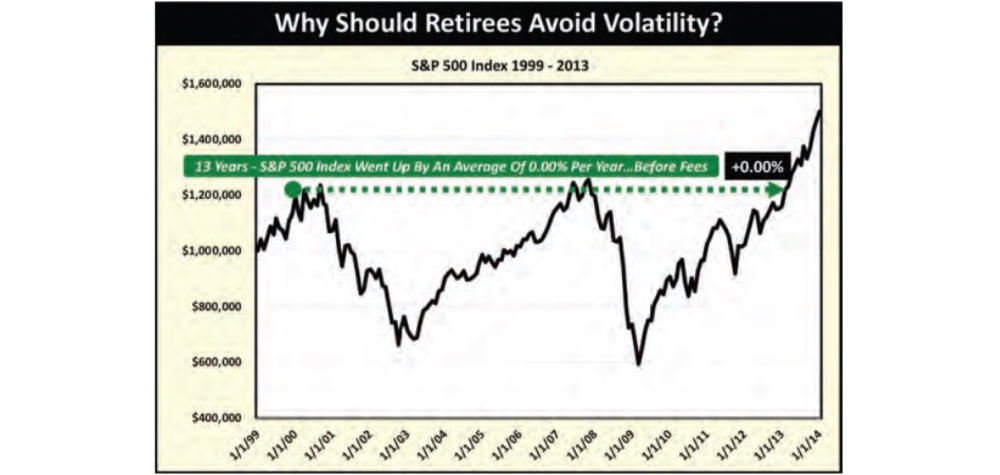
After recovering by 2007, the S&P 500 Index then lost -53% from November 2007 through March 2009. It took until 2013 to break even again, not making any gains. Fees and income distributions would increase the problem. This means for 13 years the stock market didn’t
increase at all. …0%! …Zilch! …Nada!
As we asked before, do you think you’ll have to live through any more of these types of losses in your lifetime? If you say yes, you get an “A+” because you are correct. You will most likely have multiple of these types of losses during the rest of your lifetime. Why is this important? Because losses are very hard to make up and the recovery is not guaranteed.
It is paramount to understand the impact of these types of large stock losses to your portfolio and your retirement security. Let’s look at data published by Craig Israelsen. He is a professor at Brigham Young University, and he wrote The Math of Gains and Losses. He stated with his research that if you suffer a 35% portfolio loss, you only have a 61.1% chance of getting back to even over any five (5) year time period. This means that if you suffer a 35% portfolio loss, it’s projected that almost 40% of the time you will not recover over the next five (5) years. That’s a scary thought, isn’t it? During retirement, you have to ask yourself one main question, do you really have five years to hope you get back up to even, not to make money, but hope that you just get back up to even? The answer is “NO!” You don’t have five years during retirement to hope to get back up to even.
“If you suffer a 35% portfolio loss, you will only have a 61.1% probability of getting back to even over the next five years.”
According to “The Math of Gains and Losses, ” Craig L. Israelsen Ph.D. from Brigham Young University
You have heard of the phrase “risk equals reward.” So, based on the amount of potential risk you took from 1999 through 2013 in the stock market, the graph shows you should have been rewarded with a good rate of return, after all, you suffered a -46% loss followed by a -53% loss. But you weren’t rewarded at all.
For all the risk you took, you would have been rewarded with a whopping 2.75% annual compounded increase to the S&P 500 Index before fees further reduced your returns. Is a 2.75% annual compounded increase, minus fees, worth all of the risk you took during this time period? Of course it wasn’t, but 2.75% is a mathematical fact.
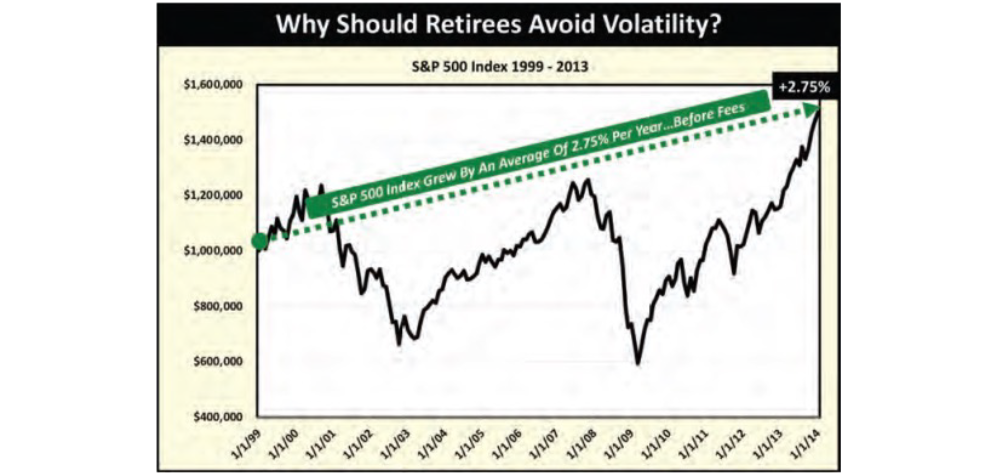
|That’s right, just 2.75% average compounded annual increase before fees. What if you were paying 3% or more in fees like we find the average retiree is paying? What did you really earn? Nothing.
Think back to when you were working, and the stock market was volatile, and you saw losses happening, but even so, over time you saw your account grow. Where do you think most of the growth of your accounts when you were working came from? The majority of your growth probably came from the additional contributions you made every year to your accounts while you were working.
If all these results weren’t amazing, in our research we found something even more astounding. There was a time period between 2000 and 2013, that was a period of 13 years, where the S&P 500 Index started at 1,469 points in January 2000 and ended at 1,469 points in January 2013.
This means for 13 years the S&P 500 Index increased by an average of 0%, basically a 0% annual increase before fees. If you paid 3% fees, that means for 13 years you lost 3% per year compounded for 13 years. These are facts, black and white, there’s no gray area. Someone should have provided you this data before you invested the first time. But it’s not too late to learn about your money. By truly learning about, and understanding your money, you can make better decisions with how much risk you’re willing to take and hopefully obtain that type of rate of return you’re shooting for.
If you had earned a 0% rate of return for 13 years before you retired while you were working, you could make changes to try and still succeed during retirement:
- You could have decided to save more.
- You could have decided to retire later.
- You could have decided you could live on significantly less income during retirement.
- You could have decided to retire anyway and then work at a different job either full-time or part-time.
But what if this had happened after you had already retired? You can’t really decide to save more during retirement. You could try and get your old job back, or find a new job, but neither option may be viable or attainable. You can live on less income but you would sacrifice the retirement lifestyle you planned for and dreamed about. But you could probably find a part-time job to replace the lost income, but you’d have to work at the part-time job for as long as you live.
As a retiree, the most important thing to understand about stock market volatility and large losses is that they will significantly reduce or completely eliminate the amount of income you can take out of your accounts and that your money may very well run out during your lifetime. As a retiree, you must always remember the number one (1) reason you saved money while you were working; so that you could use the assets for income to protect and improve your lifestyle when you were retired. You didn’t work hard and save your money to watch it go up and down and not use it, or worse, lose it during retirement; you saved it to provide you income that would not run out for as long as you lived. And above all, you didn’t save it to have to worry about it, you saved it so you’d have less worries during retirement.
If your assets are acting volatile, just described with a -46% loss between 2000 through 2002 and then followed by a -53% loss over 16-months between November 2007 through March 2009, it is mathematically impossible for you to take out a high level of income out of your assets that is guaranteed to last for as long as you live. The higher the portfolio volatility, the less income you can take out of your accounts.
Industry Standard Safe Income Withdrawal Rates
If an asset exhibits volatile behavior like the S&P 500 Index graph above, you can’t take a high level of income and be assured it will last for as long as you live. Volatile asset behavior equals volatile income behavior. Retirees want to know how much income they can safely take out of
their assets? This question is loaded with potholes. What does “safely” mean to you? Does it mean that no matter what, under all stock market conditions with 100% certainty, your income will continue to be paid to you for as long as you live? Are you OK with a 90% probability that your money won’t run out? An 80% probability that your money won’t run out? A 70% probability that your money won’t run out? If your income isn’t guaranteed to last for as long as you live, if there is any chance whatsoever you could run out of income, you will continue to worry.
For years, the financial industry has set what ended up being standards in “safe income withdrawal rates.” You can probably remember way back when, maybe 30+ years ago, it was thought the “safe income withdrawal rate” was “6%” – meaning you could take out 6% income from your assets every year with a high probability of not running out of money. Then around 20 years ago, as the stock market got more volatile and interest rates declined, the “safe income withdrawal rate” dropped to 5%. About ten years ago, the thought was that 4% might be the new industry standard “safe income withdrawal rate.” Then amazingly, with the second longest bull stock market in history running strong, 2-3 years ago the “safe income withdrawal rate” was reduced again to 3%. It is currently being debated whether the 3% should be reduced to 2.5%.
One of the most important aspects in understanding the significance of “safe income withdrawal rates” is that this is not a rate that guarantees your income will last for as long as you live, it is the rate the financial industry believes provides you a “high probability” your income will not stop. To us, rather than calm your fears of running out of money during your lifetime, “safe income withdrawal rates” actually continue to fuel your anxiety that you could run out of money. Because of this, it is our opinion that “safe income withdrawal rates” should be based on written contractual guarantees that the income will be paid to you for as long as you live and will not be affected by stock market volatility or losses. Now that is what we think should be the definition of “safe income.”
By Dan Ahmad & Jim Files